9. Benchmarks
Performance, and specifically improved application performance, is a main objective for the existence of RADICAL-Pilot. To enable users to understand performance of both RADICAL-Pilot itself and of the applications executed with RADICAL-Pilot, we provide some utilities for benchmarking and performance analysis.
During operation, RADICAL-Pilot stores time stamps of different events and activities in MongoDB, under the ID of the radical.pilot.Session. That information can be used for post mortem performance analysis. To do so, one needs to specify the session ID to be examined – you can print the session ID when running your application, via
print "session id: %s" % session.uid
With that session ID, you can use the tool radicalpilot-stats to print some statistics, and to plot some performance graphs:
$ radicalpilot-stats -m plot -s 53b5bbd174df926f4a4d3318
This command will, in the plot mode shown above, produce a 53b5bbd174df926f4a4d3318.png and a 53b5bbd174df926f4a4d3318.pdf plot (where 53b5bbd174df926f4a4d3318 is the session ID as mentioned. The same command has other modi for inspecting sessions – you can see a help message via
$ ./bin/radicalpilot-stats -m help

usage   : ./bin/radicalpilot-stats -m mode [-d dburl] [-s session]
example : ./bin/radicalpilot-stats -m stats -d mongodb://localhost/radicalpilot -s 536afe101d41c83696ea0135

modes :

  help  : show this message
  list  : show  a  list   of sessions in the database
  tree  : show  a  tree   of session objects
  dump  : show  a  tree   of session objects, with full details
  sort  : show  a  list   of session objects, sorted by type
  hist  : show timeline   of session history
  stat  : show statistics of session history (not implemented)
  plot  : save gnuplot representing session history

The default command is 'list'.  If no session ID is specified, operations
which apply to a single session will choose the last session in the given
DB.  The default MongoDB is 'mongodb://ec2-184-72-89-141.compute-1.amazonaws.com:27017/radicalpilot/'
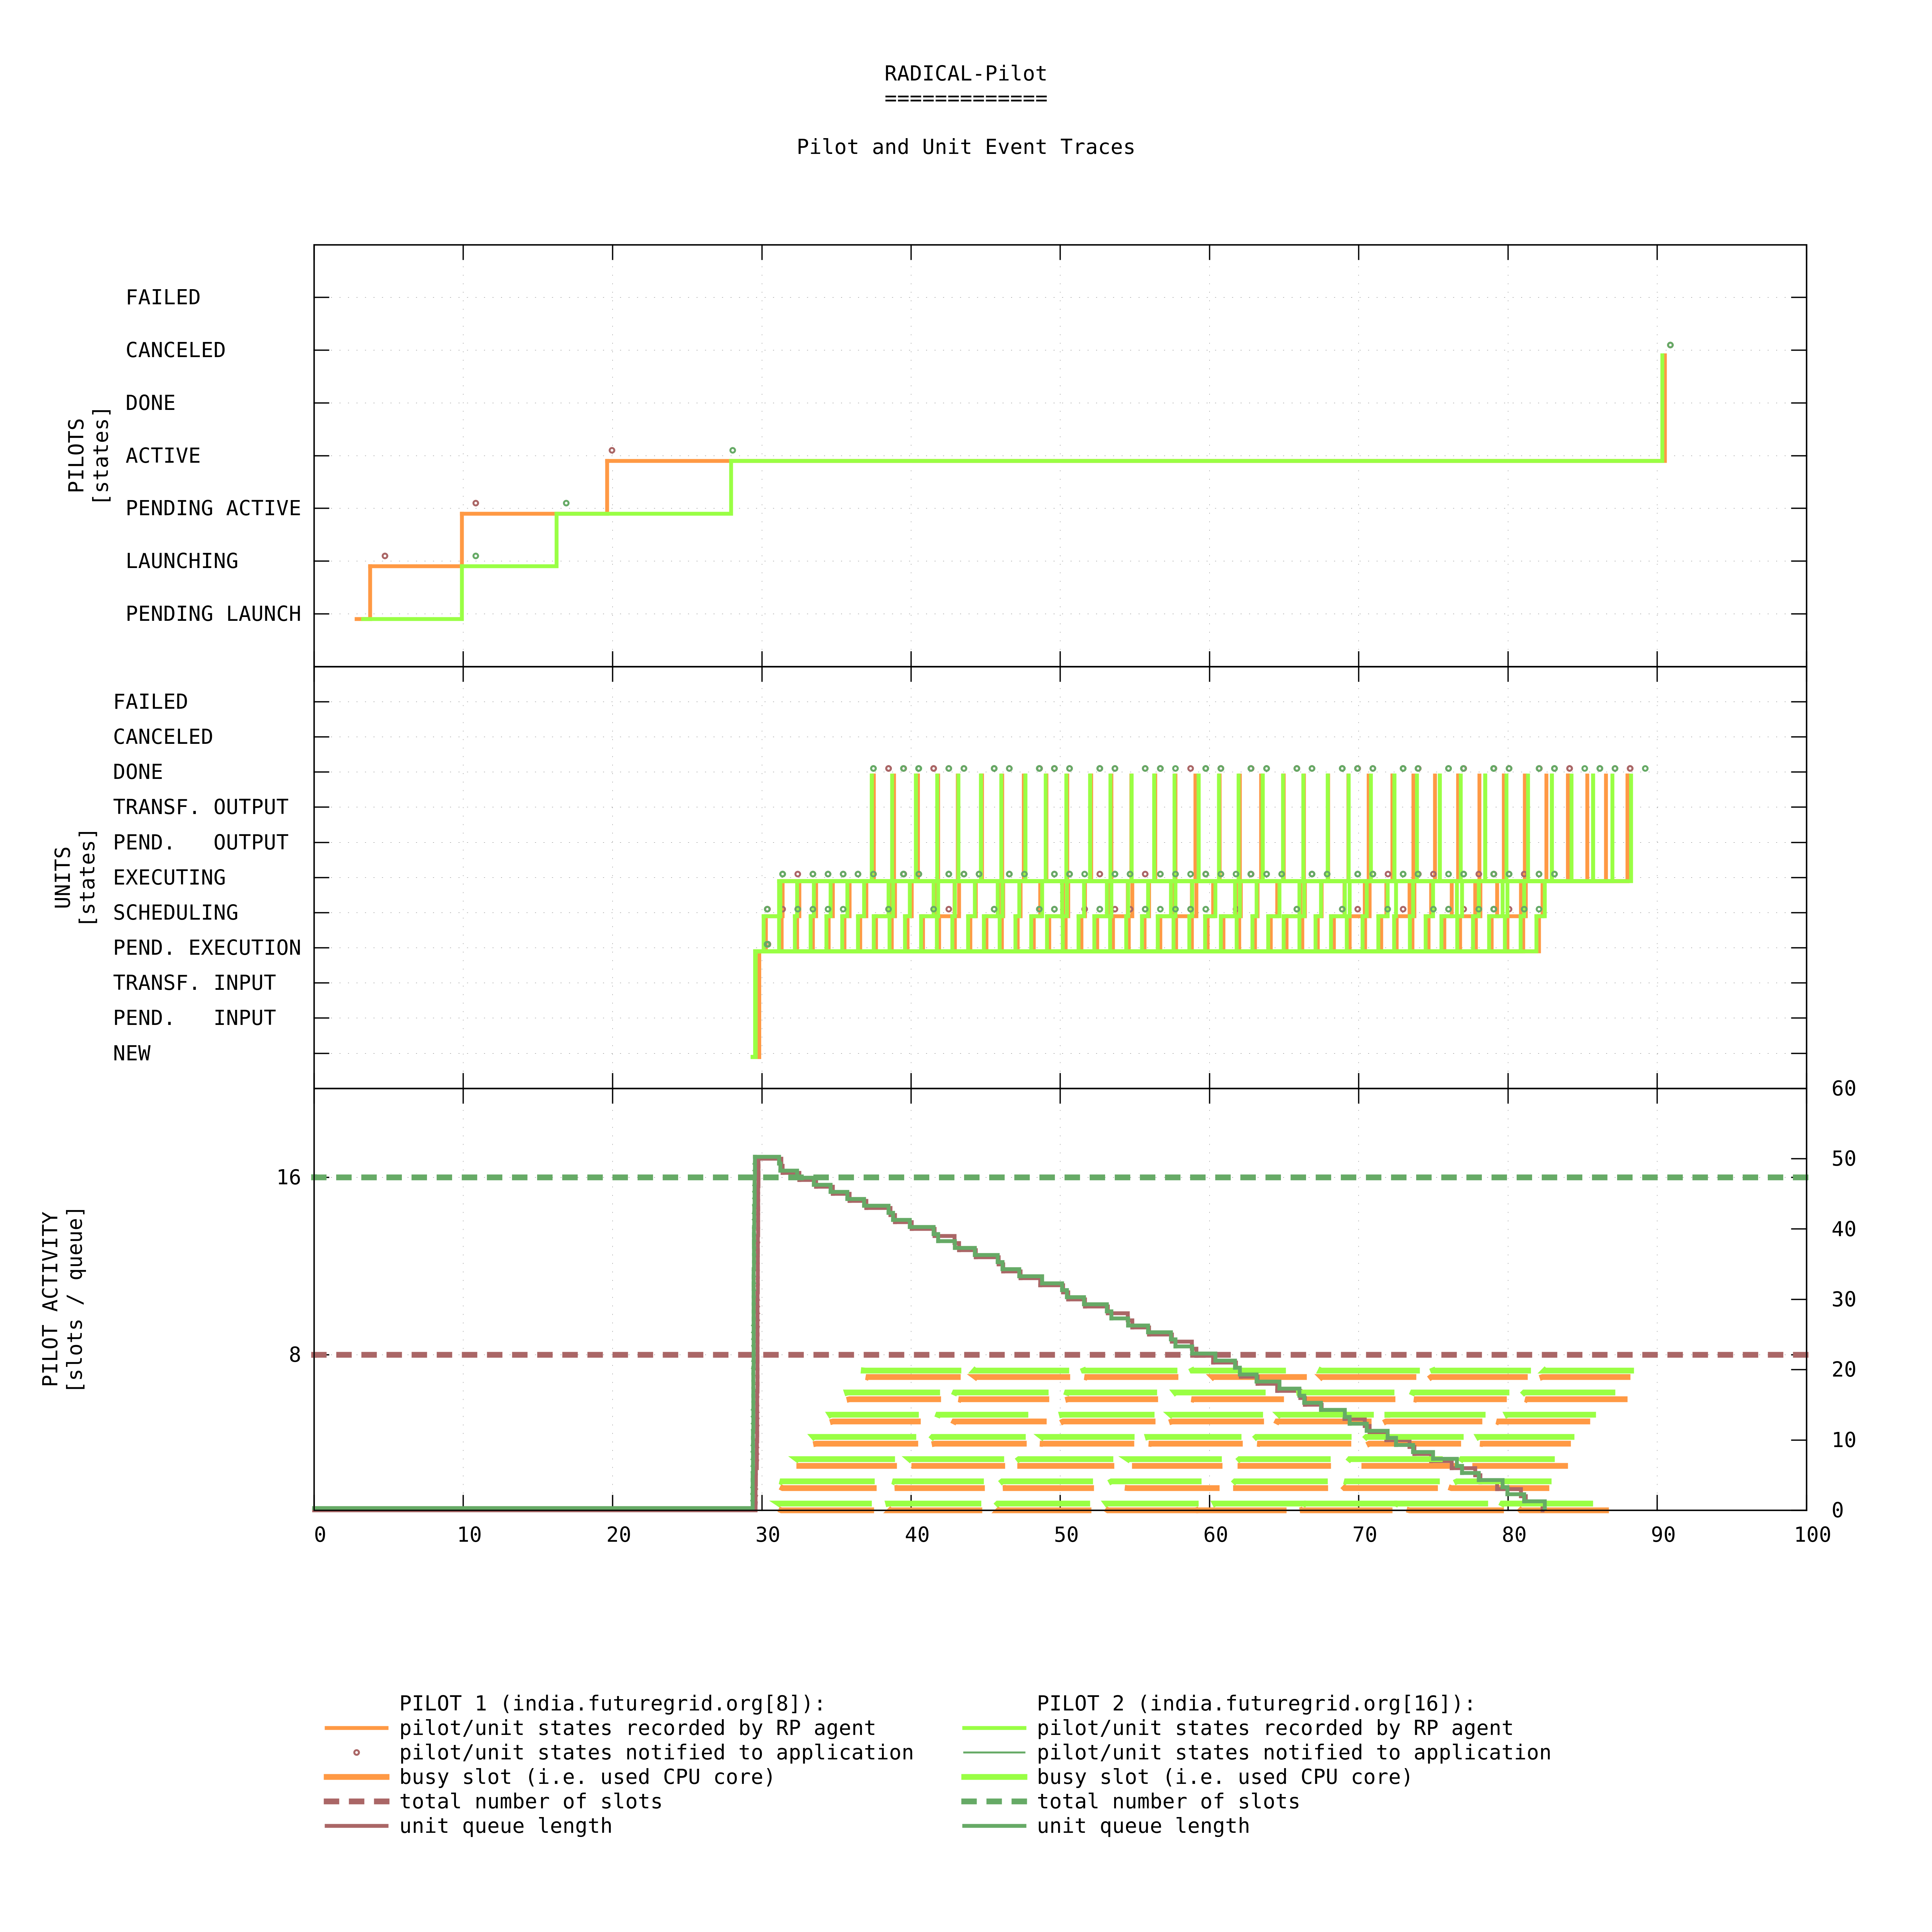
An exemplar performance plot is included below. It represents a number of events and metrics, represented over a time axis. In particular, it shows (at the bottom) the utilization of the various compute cores managed by the pilots in the session – if that utilization is showing no major gaps, your application should make efficient use of the allocated resources.