11. Benchmarks
Performance, and specifically improved application performance, is a main objective for the existence of RADICAL-Pilot. To enable users to understand performance of both RADICAL-Pilot itself and of the applications executed with RADICAL-Pilot, we provide some utilities for benchmarking and performance analysis.
Note
Performance profiling is enabled by setting RADICAL_PILOT_PROFILE in the application environment. If profiling is enabled, the application can request any number of cores on the resource local.localhost.
During operation, RADICAL-Pilot stores time stamps of different events and activities in MongoDB, under the ID of the radical.pilot.Session. That information can be used for post mortem performance analysis. To do so, one needs to specify the session ID to be examined – you can print the session ID when running your application, via
print "session id: %s" % session.uid
With that session ID, you can use the tool radicalpilot-stats to print some statistics, and to plot some performance graphs:
$ radicalpilot-stats -m plot -s 53b5bbd174df926f4a4d3318
This command will, in the plot mode shown above, produce a 53b5bbd174df926f4a4d3318.png and a 53b5bbd174df926f4a4d3318.pdf plot (where 53b5bbd174df926f4a4d3318 is the session ID as mentioned. The same command has other modi for inspecting sessions – you can see a help message via
$ ./bin/radicalpilot-stats -m help

usage   : ./bin/radicalpilot-stats -m mode [-d dburl] [-s session]
example : ./bin/radicalpilot-stats -m stats -d mongodb://localhost/radicalpilot -s 536afe101d41c83696ea0135

modes :

  help  : show this message
  list  : show  a  list   of sessions in the database
  tree  : show  a  tree   of session objects
  dump  : show  a  tree   of session objects, with full details
  sort  : show  a  list   of session objects, sorted by type
  hist  : show timeline   of session history
  stat  : show statistics of session history (not implemented)
  plot  : save gnuplot representing session history

The default command is 'list'.  If no session ID is specified, operations
which apply to a single session will choose the last session in the given
DB.  The default MongoDB is 'mongodb://ec2-184-72-89-141.compute-1.amazonaws.com:27017/radicalpilot/'
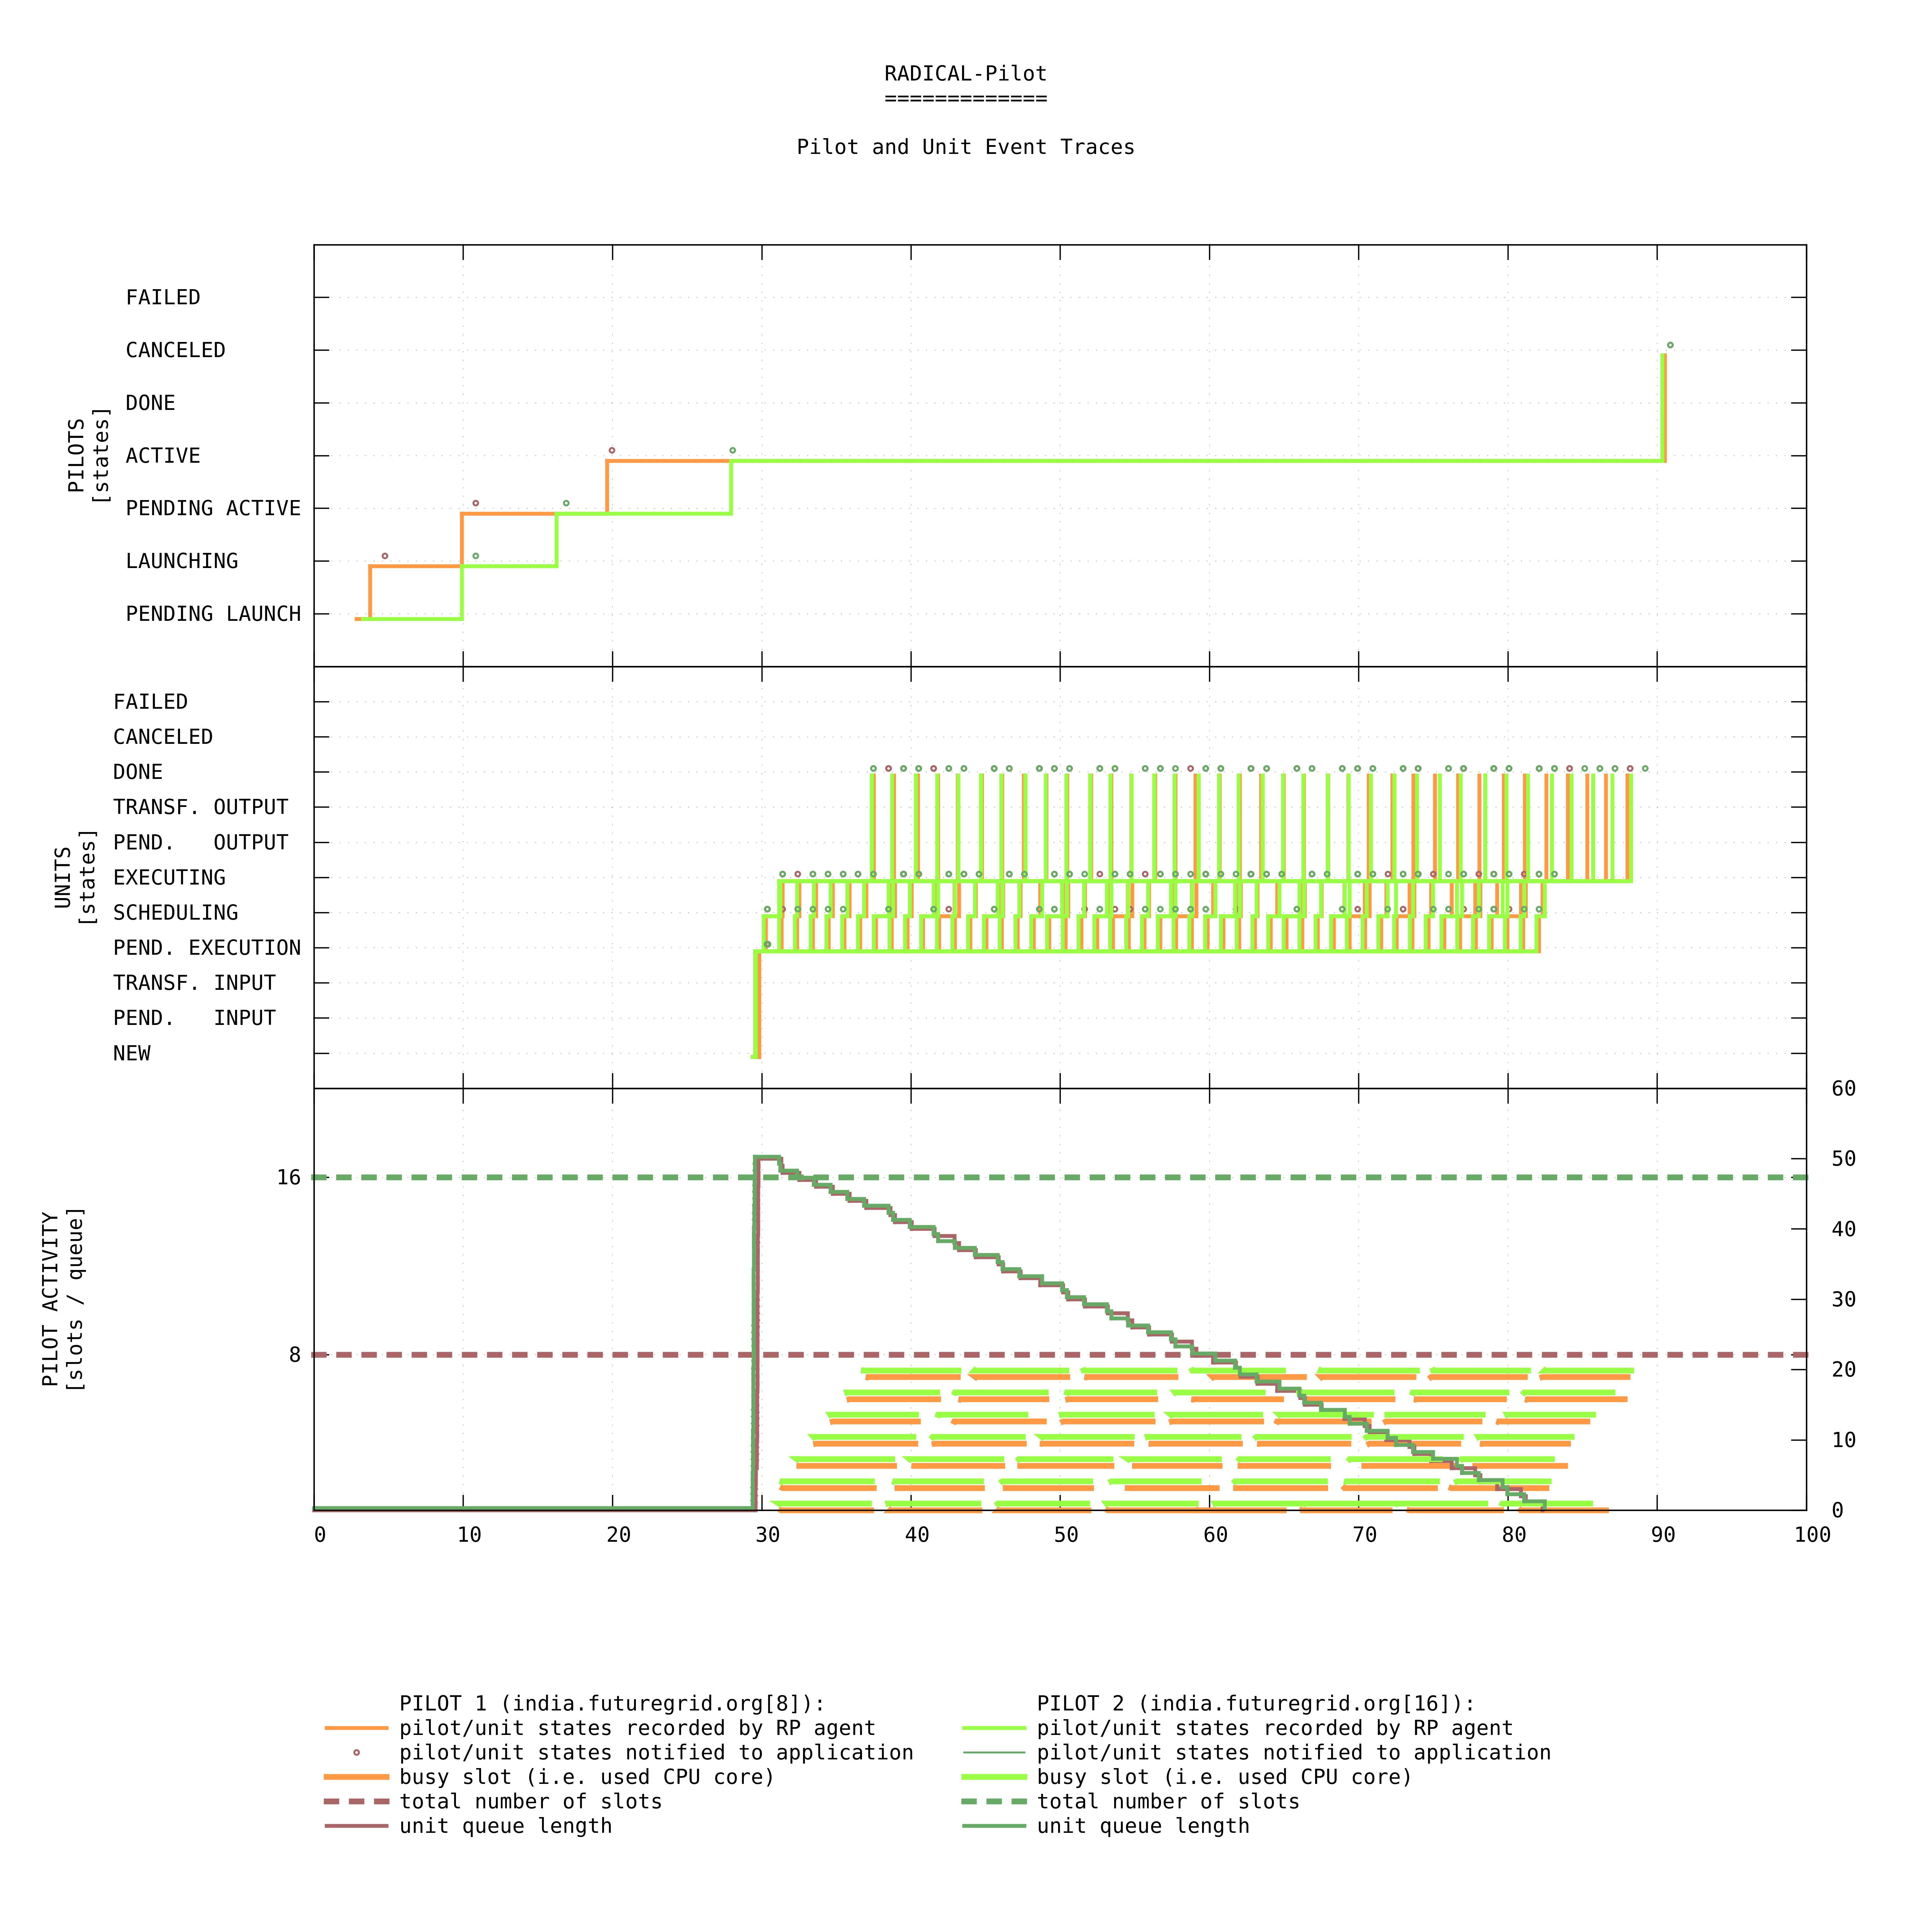
An exemplar performance plot is included below. It represents a number of events and metrics, represented over a time axis. In particular, it shows (at the bottom) the utilization of the various compute cores managed by the pilots in the session – if that utilization is showing no major gaps, your application should make efficient use of the allocated resources.
Note that the plotting capability needs an up-to-date installation of gnuoplot with the cairo-png backend. For Linux, that can be installed from the usual package repositories. For MacOS, the following should take care of the installation:
12. Details on Profiling
Note
This section is for developers, and should be disregarded for production runs and ‘normal’ users in general.
RADICAL-Pilot allows to tweak the pilot process behavior in many details, and specifically allows to artificially increase the load on individual components, for the purpose of more detailed profiling, and identification of bottlenecks. With that background, a pilot description supports an additional attribute _config, which accepts a dict of the following structure:
pdesc = rp.ComputePilotDescription()
pdesc.resource = "local.localhost"
pdesc.runtime  = 5 # minutes
pdesc.cores    = 8
pdesc.cleanup  = False
pdesc._config  = {'number_of_workers' : {'StageinWorker'   :  1,
                                         'ExecWorker'      :  2,
                                         'StageoutWorker'  :  1,
                                         'UpdateWorker'    :  1},
                  'blowup_factor'     : {'Agent'           :  1,
                                         'stagein_queue'   :  1,
                                         'StageinWorker'   :  1,
                                         'schedule_queue'  :  1,
                                         'Scheduler'       :  1,
                                         'execution_queue' : 10,
                                         'ExecWorker'      :  1,
                                         'watch_queue'     :  1,
                                         'Watcher'         :  1,
                                         'stageout_queue'  :  1,
                                         'StageoutWorker'  :  1,
                                         'update_queue'    :  1,
                                         'UpdateWorker'    :  1},
                  'drop_clones'       : {'Agent'           :  1,
                                         'stagein_queue'   :  1,
                                         'StageinWorker'   :  1,
                                         'schedule_queue'  :  1,
                                         'Scheduler'       :  1,
                                         'execution_queue' :  1,
                                         'ExecWorker'      :  0,
                                         'watch_queue'     :  0,
                                         'Watcher'         :  0,
                                         'stageout_queue'  :  1,
                                         'StageoutWorker'  :  1,
                                         'update_queue'    :  1,
                                         'UpdateWorker'    :  1}}
That configuration tunes the concurrency of some of the pilot components (here we use two ExecWorker instances to spawn units. Further, we request that the number of compute units handled by the ExecWorker is ‘blown up’ (multiplied) by 10. This will created 9 near-identical units for every unit which enters that component, and thus the load increases on that specific component, but not on any of the previous ones. Finally, we instruct all components but the ExecWorker, watch_queue and Watcher to drop the clones again, so that later components won’t see those clones eiter. We thus strain only a specific part of the pilot.
Setting these parameters requires some understanding of the pilot architecture. While in general the application semantics remains unaltered, these parameters do significantly alter resource consumption. Also, there do exist invalid combinations which will cause the agent to fail, specifically it will usually be invalid to push updates of cloned units to the client module (via MongoDB).
The pilot profiling (as stored in agent.prof in the pilot sandbox) will contain timings for the cloned units. The unit IDs will be based upon the original unit IDs, but have an appendix .clone.0001 etc., depending on the value of the respective blowup factor. In general, only one of the blowup-factors should be larger than one (otherwise the number of units will grow exponentially, which is probably not what you want).